28
Dec
Speaking at Strata 2012
I’ll be giving a workshop on effective data visualization. Get a 25% discount when registering by using the code SPEAKER25
Hope to see you there!
20
Dec
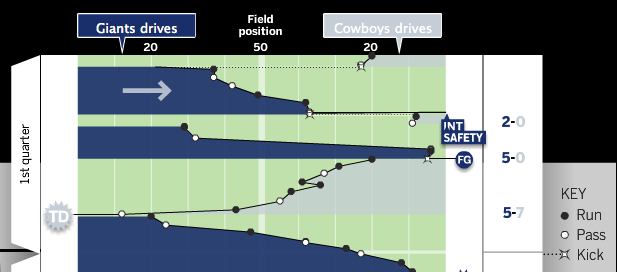
Great visualization: Pro-football game charts
From Chartball.com: Pro-football game charts.

They’ve done an excellent job here, visually representing:
- direction of play
- position of each down
- game time on the vertical axis
- type of play (run, pass, kick)
- scoring events
- other events, such as fumbles and intercepts
Great use of the field metaphor and direction, as well as team colors. I’d like to see what this looked like with encodings for the downs (shape for type of play, and down encoded by saturation?), but overall it’s excellent. And I should note that the detailed information on each play is available when you mouse-over each event.
15
Dec
Appearances at Strata NYC 2011
Two appearances from the Strata conference in New York this past September.
I gave an Ignite talk called Visualization Done Wrong. This video has too much of me and not enough of my slides.
Alex Howard interviewed me about my new book Designing Data Visualizations and related topics.
I’ll be giving a three hour data visualization workshop at Strata in Santa Clara in February 2012.
