15
Sep
A quick redesign of useless graphs
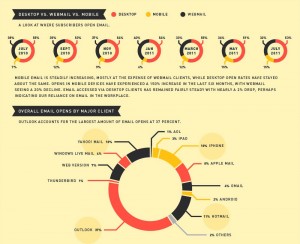
After seeing a poor infographic re-posted, I briefly ranted on twitter:
Terrible presentation of data. The bars are OK, the rest is worthless. http://bit.ly/o76BOm @litmusapp #fb #li
I don’t mean to be harsh, but #infovis culture needs constructive critique to improve, not just reposting. /cc @visualizingOrg @litmusapp
To put my mouse where my mouth (well, keyboard) is, I present two quick & dirty re-drawings, with commentary, of the first two sections of the poor infographic.
In both of these sections, an aesthetically pleasing, but not-very-functional, donut graph has been used. In both cases, it’s the wrong choice, though for different reasons.
keep reading…
12
Sep
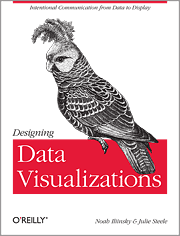
New book: Designing Data Visualizations
I’m thrilled to announce my latest book, Designing Data Visualizations.
The goal of this book is to teach you the process of designing a visualization, presenting the important considerations, and informing the choices that you make. It’s tool-agnostic, and is entirely applicable to visualizations with high and low volumes of data, and to both quantitative and qualitative visualizations.
I was fortunate to have Julie Steele as my co-author on this book. Julie was the lead editor and a contributor to Beautiful Visualization.
The origins of my thinking on this topic lie in the work I did on my master’s thesis. This book benefits from an additional five years of experience and research on my part, as well as Julie’s vital insight, knowledge, and contributions.
For this book, we (the authors) are recommending the electronic version over the print version, as that will allow you easy access to updates and revisions as we add more examples and such. Also, the print edition will sadly be only in grayscale, whereas the electronic version will be full-color.
Update: looks like we’ll be providing a full-color download of the images so that people who buy the print edition don’t miss anything.
We’re very excited about this book. We hope you will be too.
11
Sep
Presenting at Strata
I’ll be speaking at Strata NY next week. My main talk is Designing Data Visualizations, on Friday the 23rd at 11:30am.
I’ll also be presenting at the Visualization Showcase Tuesday evening, and at Ignite Strata Wednesday evening.
On Friday at 1pm I’ll be at the O’Reilly booth, signing copies of Beautiful Visualization. Not sure if Designing Data Visualizations will be available in print by then, but if it is, I’ll be signing those too. (You probably want the electronic version of DDV anyway.)
Hope to see you there!

