12
Sep
New book: Designing Data Visualizations
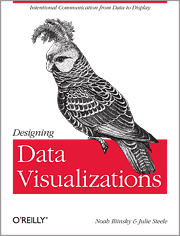
I’m thrilled to announce my latest book, Designing Data Visualizations.
The goal of this book is to teach you the process of designing a visualization, presenting the important considerations, and informing the choices that you make. It’s tool-agnostic, and is entirely applicable to visualizations with high and low volumes of data, and to both quantitative and qualitative visualizations.
I was fortunate to have Julie Steele as my co-author on this book. Julie was the lead editor and a contributor to Beautiful Visualization.
The origins of my thinking on this topic lie in the work I did on my master’s thesis. This book benefits from an additional five years of experience and research on my part, as well as Julie’s vital insight, knowledge, and contributions.
For this book, we (the authors) are recommending the electronic version over the print version, as that will allow you easy access to updates and revisions as we add more examples and such. Also, the print edition will sadly be only in grayscale, whereas the electronic version will be full-color.
Update: looks like we’ll be providing a full-color download of the images so that people who buy the print edition don’t miss anything.
We’re very excited about this book. We hope you will be too.

[…] I’ll be at the O’Reilly booth, signing copies of Beautiful Visualization. Not sure if Designing Data Visualizations will be available in print by then, but if it is, I’ll be signing those too. (You probably […]
Pingback by Presenting at Strata « Complex Diagrams — September 12, 2011 @ 12:33 pm
[…] shouldn’t trump function. to learn more about how to design visualizations well, check out Designing Data Visualizations. Filed in Visualization | Tags: beautiful_visualization, graphs, how to, mine, […]
Pingback by A quick redesign of useless graphs « Complex Diagrams — September 16, 2011 @ 9:01 am
[…] Alex Howard interviewed me about my new book Designing Data Visualizations. […]
Pingback by Appearances at Strata NYC 2011 « Complex Diagrams — December 15, 2011 @ 12:54 am
[…] Update 2011: Many of the ideas in this thesis have evolved and been carried over into my book Designing Data Visualizations. […]
Pingback by Generation of Complex Diagrams: How to Make Lasagna Instead of Spaghetti « Complex Diagrams — December 17, 2011 @ 5:03 pm
[…] technique largely depends on the specific goals you’re trying to achieve with the chart. As explained in depth by visualization expert Noah Iliinsky, we need to differentiate at least between exploration and […]
Pingback by Making Pictographs? Choose Your Icons Wisely! | vis4.net — April 22, 2013 @ 3:00 pm