12
Sep
New book: Designing Data Visualizations
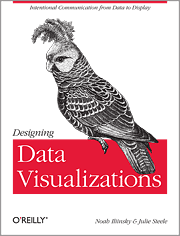
I’m thrilled to announce my latest book, Designing Data Visualizations.
The goal of this book is to teach you the process of designing a visualization, presenting the important considerations, and informing the choices that you make. It’s tool-agnostic, and is entirely applicable to visualizations with high and low volumes of data, and to both quantitative and qualitative visualizations.
I was fortunate to have Julie Steele as my co-author on this book. Julie was the lead editor and a contributor to Beautiful Visualization.
The origins of my thinking on this topic lie in the work I did on my master’s thesis. This book benefits from an additional five years of experience and research on my part, as well as Julie’s vital insight, knowledge, and contributions.
For this book, we (the authors) are recommending the electronic version over the print version, as that will allow you easy access to updates and revisions as we add more examples and such. Also, the print edition will sadly be only in grayscale, whereas the electronic version will be full-color.
Update: looks like we’ll be providing a full-color download of the images so that people who buy the print edition don’t miss anything.
We’re very excited about this book. We hope you will be too.
11
Sep
Presenting at Strata
I’ll be speaking at Strata NY next week. My main talk is Designing Data Visualizations, on Friday the 23rd at 11:30am.
I’ll also be presenting at the Visualization Showcase Tuesday evening, and at Ignite Strata Wednesday evening.
On Friday at 1pm I’ll be at the O’Reilly booth, signing copies of Beautiful Visualization. Not sure if Designing Data Visualizations will be available in print by then, but if it is, I’ll be signing those too. (You probably want the electronic version of DDV anyway.)
Hope to see you there!
20
May
How to buy a practical bike
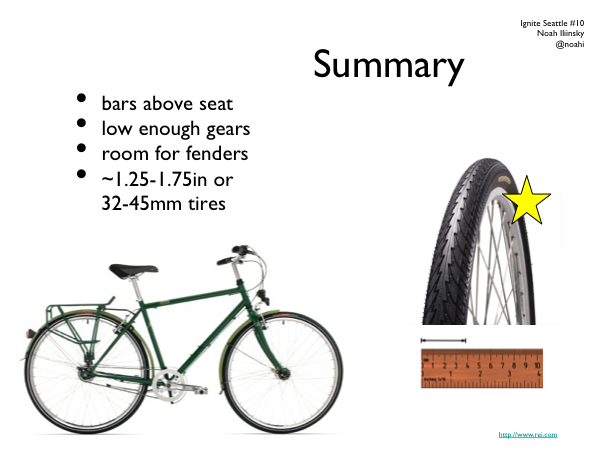
Last summer I gave a talk at Ignite Seattle on how to buy a practical bike. This is the slide deck for that talk. There’s no audio, but you can gather most of it from the images. The summary is below the presentation.
In general, when shopping for a bike, the best thing you can do is ride several and find one that sings to you. Details of manufacturer and parts are less relevant if you like how the bike feels when you ride it.
- At a give price point, most new bikes are going to have a similar mix and quality level of parts.
- Look for a bike where you can get the handlebar at or above the height of the seat when the seat is adjusted to your leg length.
- Low gears are critical if you live near hills or plan on carrying or pulling loads.
- You probably want at least 32mm / 1.25″ wide tires. You don’t need a suspension, or knobby offroad tires, or any tread at all, in the city.
- Your frame should have room for fenders (you can wait until September for those, but shops may install them free if you buy with your new bike).
18
May
UIE Virtual seminar podcast
Here’s the podcast and transcript that goes with my virtual seminar on visualization for UIE. In this podcast I talk a lot about basic visualization concepts, with some good Q&A. It’s good foundational material.
9
Mar
Podcast with Jared Spool
Jared Spool interviewed me for Brain Sparks. It’s a 30 minute podcast; the title is Steps to Beautiful Visualizations.
Update: there’s a mostly-accurate transcript available as well.
23
Feb
Web App Master’s Tour
This year I’ll be presenting at the Web App Master’s Tour, along with many other brilliant folks. Come see us in Philadelphia March 21-22, Seattle May 23-24, or Minneapolis June 27-28.
Save $100 off the current price by using the discount code WAMT11. That plus the early bird savings is worth $300 total off of the the standard price.
I look forward to seeing you there!
9
Dec
How to design visualizations
I posted a quick process reference called How to design good data visualizations, diagrams, and information graphics over at O’Reilly Answers.
16
Dec
Working on Beautiful Visualization book
I’m very excited to announce that I’m technical editor for, and contributing a chapter to, the book Beautiful Visualization, due out in April from O’Reilly.
It is a collection of case studies and articles discussing how various beautiful information visualizations were achieved and how to create your own.
Stay tuned for updates as events warrant.
26
Feb
VizThink wrap-up and notes
VizThink ’09 was awesome. I’ve come back exhausted, energized, and inspired, with a load of new ideas.
Thanks to everyone who presented, who attended my sessions, who asked good questions in all situations, who I talked with and listed to and shared meals with. It was a fantastic time. Special thanks goes out to the crew (and families of!) who put on the conference; I appreciate your hard work and perseverance.
As promised, here are the documents that support my sessions. The best online version of my User-Centered Information Design talk is the version from Infocamp ’08, which includes narration. The only slides missing from that presentation are the design process guidance slides, which I’ve made into a handy PDF.
The snapshot talk on visualizing complexity was supported by this document.
As always, I’d love to hear from you about what worked, what didn’t, lingering or new questions, and anything else on your mind.
12
Feb
Bourbon-molasses Supernatural Brownie recipe
[I’m justifying posting a recipe here with the thinking that good food is a good user experience.]
These are my favorite brownies. The recipe is shamelessly stolen (and modified) from the The New York Times and The Splendid Table. See those sites for advice on using baking parchment, fancy unpanning, adding nuts (blasphemy!) or frosting, etc. My additions and notes start with an *.
keep reading…

